Airtable
Automated internal systems and dashboards for better visibility.
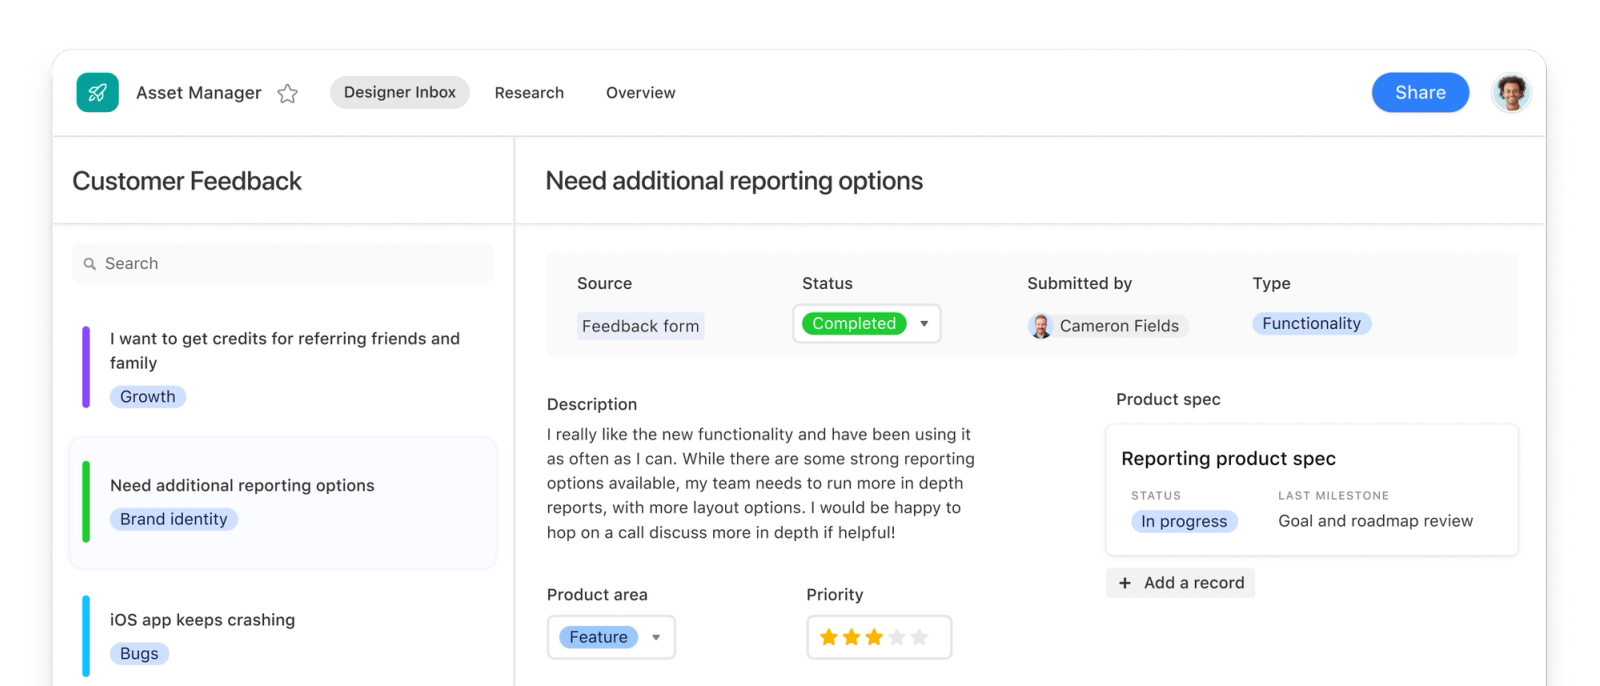
Client Brief
Who they are and what they needed.
- Client
- Airtable (internal systems build)
- Industry
- No-code / internal tooling
- Market cap
- Not applicable
- Market size
- Not applicable
An internal systems engagement: building automated tracking, dashboards and cross-team visibility on a no-code foundation. Draft entry — scope and client relationship to be confirmed.
Pain Point
Where the friction lived.
Information existed, but it lived scattered across tools and inboxes, so no one had one honest picture of the state of the business. Draft assessment — to be validated.
Current bottlenecks
- Status reporting was assembled manually for every review meeting.
- Different teams answered the same question with different numbers.
- Requests and follow-ups were tracked in personal inboxes.
Gaps in SOPs
There was no agreed definition of the operational numbers that matter, so each report re-invented its own version of the truth.
Scalability
Manual reporting does not scale with growth — every new team or project added effort to the very process that was supposed to create visibility.
Feasibility of the solution
Valid: the underlying data already existed in the tools the team used; the gap was consolidation and presentation, not collection.
Growth rate & savings potential
The savings potential sat in eliminating recurring manual reporting effort and the decisions made on stale or inconsistent data. Figures to be confirmed.
Eliminating friction, improving ROI
The recurring reporting ritual was the single biggest friction point; automating it delivered immediate, visible returns while deeper systems work continued.
Solution & Objective
What we proposed and built.
Automated internal systems and dashboards built on a no-code base.
- Objective
- Give every team one reliable view of what is happening — sourced automatically from the tools already in use, with agreed definitions behind every number.
- Technology
- No-code data layer (Airtable-based systems), automated syncs from existing tools, and role-specific dashboards with live views.
- Strategy
- Agree the definitions first, then automate the flow — one source of truth per fact, owned by the team that produces it.
- Go-to-market
- For internal systems, adoption is the go-to-market: make the dashboard the easiest place to answer questions so it becomes the default, not an obligation.
- Funnel analysis
- Mapped the information flow from source tools to consolidated dashboards, treating each manual step as a drop-off point to eliminate.
Projections · Q1 2027
What we're working toward.
Illustrative projections, not measured results or client-validated forecasts. These planning ranges use assumed improvements, not supplied baseline data. Results are expected in Q1 2027.
30–45%
Illustrative projection
Manual reporting effort reduction
20–35%
Illustrative projection
Time to answer operational questions reduction
20–30%
Illustrative projection
Cross-team data inconsistency reduction
Intended outcome
The intended outcome is dependable visibility: automated reporting could reduce recurring effort and help teams work from shared definitions. The next reporting cycle will test these planning assumptions against actual usage.
Further improvements
- Add alerting for metrics that drift outside normal ranges.
- Extend the model to finance and people reporting.
- Introduce lightweight forecasting on top of the live data.
More of our work
All case studiesLET'S BUILD TOGETHER
You don't need another disconnected solution.
A quick call to understand your goals and explore how we can help.